In the final article I finish the series about the IoT hackathon project by explaining the server side component of the system. Admittedly, it is the smallest part and I intentionally chose to make it trivially simple. 4 days of project of work is not infinite, after all. I think it took me roughly 4-6 hours to set everything up.
The project source code is available at github. You’re welcome.
Overall server-side design
I knew that reverse engineering might take longer to complete. I wasn’t even sure I would succeed. Hence, I decided to design the backend as simple as possible. I chose to avoid writing my own service, storage and visualization. Instead, I chose to rely on Amazon IoT, Lambda and CloudWatch AWS components. The goal was to only write code that streams the data into Amazon and then configure everything else in the management console. This would also be a nice exercise in trying out AWS components and IoT-related APIs I haven’t had a chance to work with.
The interface between my program and Amazon services was handled by Amazon IoT. Amazon IoT is a set of components to facilitate communication with Internet-connected devices. There is a component to receive messages and another component (called “IoT rules”) to route messages to various destinations. Amazon IoT supports a popular messaging MQTT protocol that is designed to be used in high-latency and unreliable networks for small sensors and mobile devices.
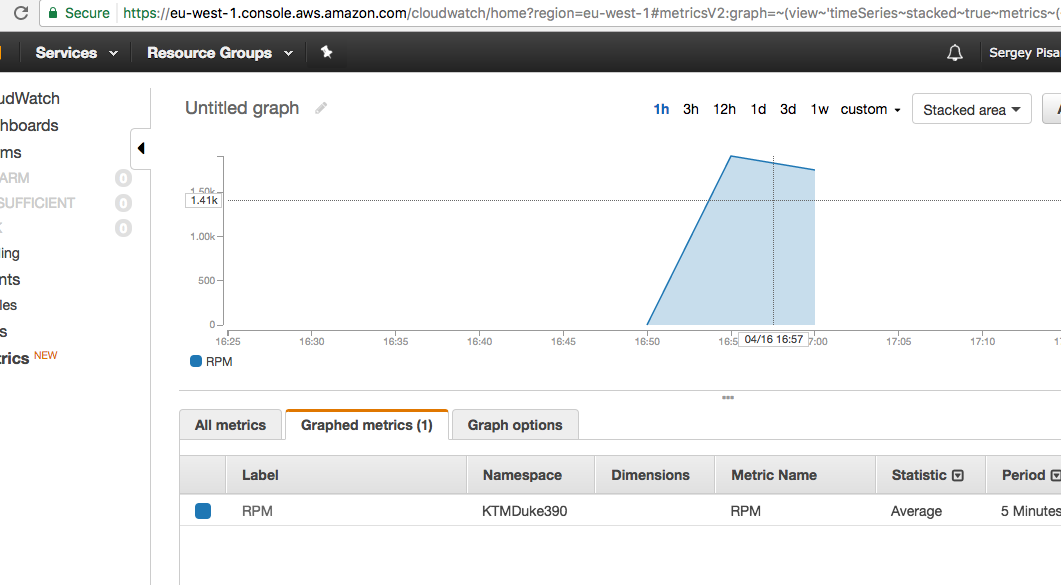
My overall goal was to just send the data and somehow display it. I chose Amazon CloudWatch as the visualization solution. CloudWatch is component for watching and reacting to service metrics (such as uptime, error rates). It is, however, possible to define custom metrics. So I have setup my own “RPM” and “Throttle” metrics.
To forward messages from Amazon IoT to CloudWatch I used another Amazon component called Lambda. Lambda lets define functions to be triggered on various events. The functions themselves can be written in multiple programming languages such as Java, Python, JavaScript and others. My Lambda function would be triggered by an incoming IoT message and it would then forward the value as a CloudWatch metric.
Overall, I ended up with a “serverless” backend. In other words, I avoided writing my own service and having to deal with deployments, data storage and visualization. If I had more time I would have done things differently.
Amazon IoT setup
To start with Amazon IoT it’s necessary to create a new “thing” and then download a bunch of certificates to be used in communication. I found a library for Java called Paho for the MQTT communication. Java doesn’t support SSL certificates in the PEM format so I had to use a library called BouncyCastle and a snippet I found online to make it work.
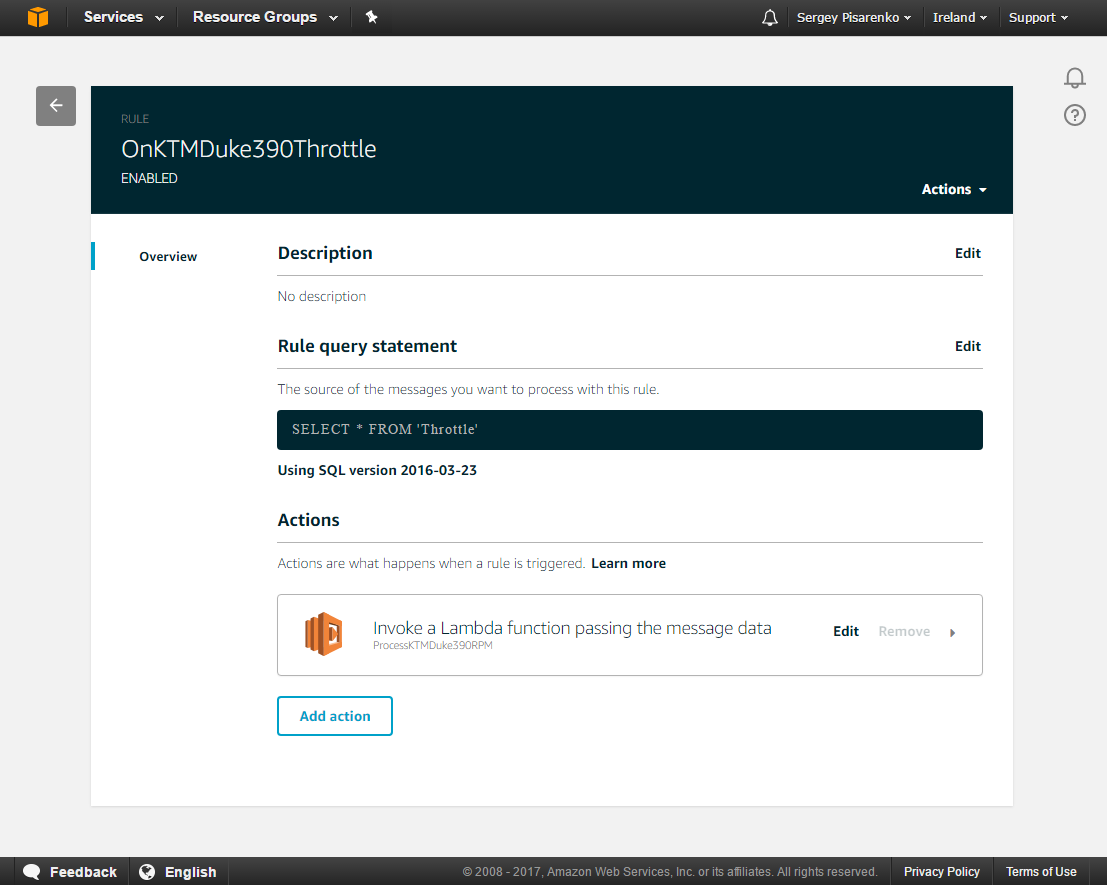
Once defined, sending and receiving messages is easy. Amazon also provides testing tools built into the management console to troubleshoot and try things out. After checking that messages successfully reach Amazon I defined a rule that passes received data to a Lambda function:
Amazon CloudWatch
To visualize real-time data I chose an unorthodox solution to display them in a monitoring component. Clearly, CloudWatch is designed with a different purpose in mind. It’s not built as a visualization tool. Still, it was good enough for the prototype. To display custom metrics it’s necessary to define them. That’s currently possible only through AWSCLI tool or the API:
$ aws --profile=private cloudwatch list-metrics
$ aws --profile=private cloudwatch put-metric-data --metric-name RPM --namespace KTMDuke390 --unit Count --value 0
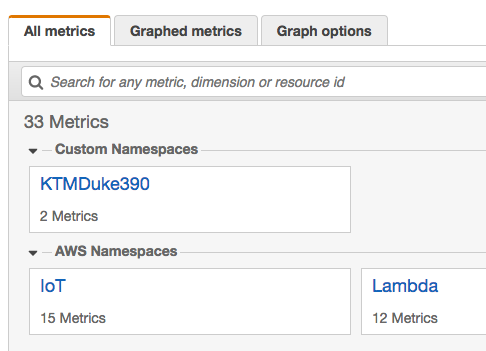
$ aws --profile=private cloudwatch put-metric-data --metric-name Throttle --namespace KTMDuke390 --unit Count --value 0The custom metrics can be then seen in CloudWatch console:
Amazon Lambda
Amazon Lambda connects the other two components together. I defined a function in JavaScript that takes the message received by Amazon IoT (the message is in JSON format, by the way) and stores it as a metric in CloudWatch. Here’s the code I wrote:
var AWS = require('aws-sdk');
var cloudwatch = new AWS.CloudWatch();

exports.handler = (event, context, callback) => {
    console.log('Received event:', JSON.stringify(event, null, 2));
    var params = {
        MetricData: [{
            MetricName: event.type,
            Timestamp: new Date(Date.parse(event.timestamp)),
            Unit: 'Count',
            Value: event.value
        }],
        Namespace: 'KTMDuke390'
    };

    cloudwatch.putMetricData(params, function(err, data) {
        if (err) console.log(err, err.stack); // an error occurred
        else     console.log(data);           // successful response
    });

    callback(null, 'OK');
};
It’s worth to mention that I needed to give the role account of the Lambda function access rights to CloudWatch. Otherwise, it fails.
Closing words
As you see, working with AWS is not complicated. I managed to get from no AWS account to everything in roughly a day’s work. I also managed to achieve all this using their free tier so I paid 0$. I don’t like how the data is displayed and the client is not very efficient (messages could be batched together, for example). The biggest improvement would come from better presentation. I’d like to use D3.js, which is a powerful visualization library.
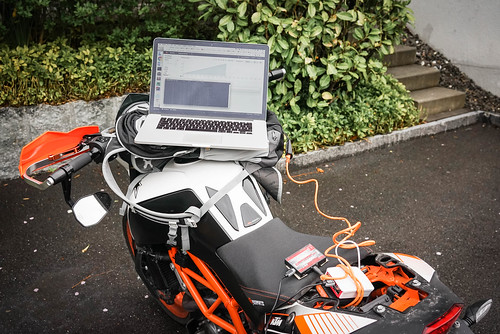
In any case I completed the project goals I had set for myself: my KTM motorcycle was connected to the Internet, even if briefly. Of course, the improvement possibilities are boundless. I hope you enjoyed reading the series. I definitely enjoyed working on this project. Don’t forget that the source code is published at github, in case you’re interested in further Power Commander 5 hacking.